Right heart catheterization in heart failure: indications, interpretation, and pitfalls
Authors, Journal, Affiliations, Type, DOI
- Katarina Zeder, Susanna Mak, Nazzareno Galie, Stephan Rosenkranz, Bradley A. Maron
- European Heart Journal (2025) 46:3354–3372
- University of Maryland, University of Toronto, University of Bologna, University of Cologne
- State of the Art Review
- DOI: https://doi.org/10.1093/eurheartj/ehaf322
Overview
This state-of-the-art review provides a comprehensive practical guide to right heart catheterization (RHC) across the full heart failure spectrum — from ambulatory chronic heart failure through acute decompensation, cardiogenic shock, LVAD candidacy, and heart transplantation evaluation. It addresses RHC methodology and common pitfalls in PAWP interpretation, hemodynamic thresholds for each clinical scenario, and contextualisation within the clinical presentation. Future directions including non-invasive PAWP technologies and novel haemodynamic parameters are also discussed.
Keywords
Right heart catheterization, Acute heart failure, Chronic heart failure, Cardiac transplantation, Cardiogenic shock
Key Takeaways
Methodology and Technical Considerations
- RHC should be performed with the patient supine via the right internal jugular vein (preferred); ultrasound-guided access reduces bleeding complications
- Zero-reference must be at the mid-thoracic level (equivalent to the left atrium); 1 cm deviation changes measured pressure by ~0.8 mmHg
- Cardiac output: direct Fick is gold standard; thermodilution is an acceptable alternative (average 3–5 measurements, <10% variability); indirect Fick is less reliable; thermodilution is unreliable with shunts
- All pressures measured at end-expiration; in patients with large respiratory swings (COPD, obesity, mechanical ventilation) average over 3–4 respiratory cycles
- PAWP measured just prior to the C-wave (closest to LVEDP); if C-wave indeterminate, gate to QRS complex; use mean PAWP when large V-waves present (e.g. severe mitral regurgitation)
- PAWP must always be ≤ diastolic PAP; clear A- and V-waves must be visible to confirm correct wedging
- Atrial fibrillation can cause overestimation of PAWP compared to direct LVEDP
- Post-diuresis: PAWP may be falsely low (overestimates PVR); volume-overloaded state: PAWP may be falsely elevated due to ventricular interdependence
- Mixed venous O₂ saturation >75% should prompt stepwise oximetry run to exclude left-to-right shunt
- Safety: serious adverse events ~1.1%, procedure-related mortality ~0.055% in experienced PH centres; most feared complication is PA perforation
PAWP Thresholds and the Zone of Uncertainty
- Normal upper limit of PAWP: 13 mmHg (meta-analysis, n=940 healthy subjects); women have slightly higher normal PAWP than men
- Post-capillary PH defined by PAWP >15 mmHg (current ESC PH guidelines)
- "Zone of uncertainty": PAWP 12–18 mmHg should be contextualised to individual clinical probability of left heart disease; provocative testing may be appropriate in this range
- Exercise RHC: mPAP/CO slope >3 mmHg/L/min defines exercise PH; peak PAWP >25 mmHg diagnoses HFpEF
- PAWP/CO slope >2 mmHg/L/min associated with worse outcomes and clinically diagnosed HFpEF
- Fluid challenge: PAWP ≥18 mmHg after 500 mL rapid saline infusion suggests HFpEF; passive leg raise is a simpler alternative
RHC in Chronic Heart Failure
- PH criterion: mPAP >20 mmHg; PAWP ≤15 mmHg + PVR >2 WU = pre-capillary PH; PAWP >15 mmHg = post-capillary PH (isolated if PVR ≤2 WU; combined if PVR >2 WU)
- Bi-ventricular HF pattern: mPAP ~25–35 mmHg, PAWP >15 mmHg, RAP >8 mmHg, mildly elevated PVR (2–5 WU), reduced LVEF, mild-to-moderate RV dysfunction
- "Right heart predominant" left HF phenotype: mPAP >35 mmHg, PAWP >15 mmHg, RAP >12 mmHg, PVR >5 WU, CI <2.2 L/min/m², severe TR, severe RV failure, cardio-hepato-renal syndrome
- Constrictive pericarditis vs restrictive cardiomyopathy: both show RAP:PAWP >0.5; constrictive physiology shows discordant RAP↑/PAWP↓ with inspiration; restrictive cardiomyopathy shows concordant pressure changes; simultaneous right + left heart catheterisation often required
- ESC Class 2b: RHC may be considered to confirm HFpEF diagnosis in selected patients (may change diuretic or SGLT2i therapy)
- AHA Class 3: routine RHC not recommended to guide HF treatment decisions; may provide useful clinical information in selected patients
- CHAMPION trial: wireless hemodynamic monitoring guided by PAP reduces HF hospitalisations by 33% (ESC Class 2b recommendation)
- RV-PA coupling (Ees/Ea ratio): assessed by conductance RHC or non-invasively via TAPSE/sPAP ratio; identifies RV-PA uncoupling sub-phenotype in chronic left-sided HF; prognostic in HFpEF
RHC in Valvular Heart Disease
- ESC: RHC reserved for inconclusive or discordant non-invasive assessment; if sPAP >50 mmHg is the only criterion for surgical indication, RHC confirmation required
- Severe TR: Doppler gradients may unreliably assess PH severity; RHC with PVR assessment recommended (ESC Class 1 for severe TR pre-intervention)
- Severe primary MR: RHC to confirm PH (sPAP >50 mmHg at rest) when this is the only criterion for surgical referral
- Mitral stenosis: direct pressure gradient measurement indicated if imaging is difficult; AHA Class 1 for RHC at rest and during exercise in characterising LV, LA, and PA haemodynamics
- Aortic stenosis: RHC gold standard for PH diagnosis, which is a strong predictor of mortality in severe AS; improves prognostic power over echocardiography alone (not specifically in ESC guidelines but widely used pre-AVR)
RHC in Acute Heart Failure
- Diamond-Forrester classification (1973): warm/cold (CI cut-off 2.5 L/min/m²) and wet/dry (PAWP cut-off 18 mmHg); still used but ESC 2021 prefers clinical phenotype classification
- Acute LV failure: PAWP >15 mmHg, usually maintained CI (≥2.5 L/min/m²) and blood pressure
- Acute isolated RV failure: PAWP normal/high-normal (<18 mmHg), CI <2.5 L/min/m², RAP >8 mmHg, reduced systemic blood pressure
- Acute bi-ventricular failure: PAWP >15 mmHg, RAP >8 mmHg, CI <2.5 L/min/m², RAP:PAWP >0.5
RHC in Cardiogenic Shock
- SCAI shock stages A–E; all stages B–E involve PAWP >15 mmHg (>20 mmHg in Stage E); CI <2.2 L/min/m² in Stages C–E; RAP >10 mmHg
- Isolated RV cardiogenic shock: RAP strongly elevated (>14 mmHg), PAWP normal/high-normal (<18 mmHg), RAP:PAWP >0.5–0.8, decreased PAPI and CI
- Mixed venous O₂ saturation ≥65% in Stages A+B; decreased in Stages C–E; increased in late-stage septic shock
- Cardiogenic shock haemodynamic profile: low CI, high PAWP, high SVRI ("cold and wet"); vasodilatory shock: high CI, normal PAWP, low SVRI ("warm and dry")
- Isolated RV infarction shock: RAP:PAWP ≥0.8
- Early RHC (within 2 days) in cardiogenic shock: lower AKI incidence (OR 0.69), higher MCS use (OR 1.67), shorter hospital stay vs late RHC (observational data)
- Advanced haemodynamics: PAPI <2.0 and cardiac power output (CPO) <0.6 Watts in SCAI Stage C; RVSWI reflects RV workload; these parameters not yet in European guidelines
RHC in Heart Transplantation
- Class 1 recommendation (ISHLT): RHC prior to listing and periodically every 3–6 months until transplantation
- PAWP >18 mmHg (regardless of CO status) significantly associated with increased waitlist death, delisting, urgent HTX, and LVAD implantation
- Pre-transplant PVR >2.5 WU significantly associated with increased post-HTX mortality (n=26,649; multivariate)
- Prohibitive PH: sPAP ≥50 mmHg + (TPG ≥15 mmHg or PVR ≥3 WU)
- Acceptable vasodilator response: TPG ≤12–15 mmHg + PVR ≤2.5–3 WU + systolic BP >85 mmHg
- If PVR reversible but BP falls <85 mmHg: RV failure risk remains high
- If vasodilator challenge fails: hospitalisation with diuresis/vasoactive therapy → temporary MCS → durable LVAD
- LVADs can improve or reverse PH; if PH persists after 3–6 months of effective LV unloading, considered irreversible → HTX precluded
- Post-HTX RHC: Grade 3 cardiac allograft vasculopathy (75% 5-year mortality) → restrictive physiology (RAP:PAWP >0.5) on RHC can inform re-transplantation decision
RHC in LVAD
- LVAD candidacy criteria: PAWP ≥20 mmHg + systolic BP ≤90 mmHg or CI ≤2.0 L/min/m² (among other factors)
- Pre-implantation: RHC within 1–2 weeks for elective cases; goal RAP ≤12–15 mmHg prior to surgery
- Post-implantation ramp test: optimise LVAD speed; target RAP <12 mmHg and PAWP <18 mmHg; detect thrombosis/malfunction
- RV failure pre-LVAD predictors: RAP >15 mmHg, RAP/PAWP >0.63 (1-year survival 59% vs 78% in those without RV failure)
- PAPI <1.85: 95% sensitivity for post-LVAD RV failure; outperforms RAP, RAP:PAWP, and RVSWI
- LVAD explantation criteria (myocardial recovery): CI >2.6 L/min/m² + RAP <10 mmHg + PAWP <13 mmHg confirmed during serial speed reduction trials (Class 2a)
Future Directions
- Non-invasive PAWP: 4D-flow CMR (r=0.94 with invasive PAWP); lung B-lines (AUC 0.73 for PAWP >15 mmHg); left atrial strain (AUC 0.9); mitral/tricuspid valve opening time difference (moderate sensitivity, high specificity)
- Pulmonary arterial compliance (PAC = stroke volume/pulmonary pulse pressure): PAC ≥3.0 mL/mmHg associated with improved survival in PH; early decrease may identify risk for right heart failure before PVR rises
Data From Embedded Figures
The source PDF renders its graphical abstract and all six figures as images, not selectable text, so their content is not machine-readable in raw/RHC-HF-EHJ-2025.md. Each has been read and transcribed below, with the image embedded alongside so the visual and the data are both available. Several of these carry haemodynamic cut-offs that the running text states only in part — notably the full six-phenotype chronic HF table (Figure 3), the two LV sub-branches of acute HF (Figure 4), and the complete SCAI stage values with lactate thresholds (Figure 5).
Graphical Abstract — RHC Across the HF Spectrum
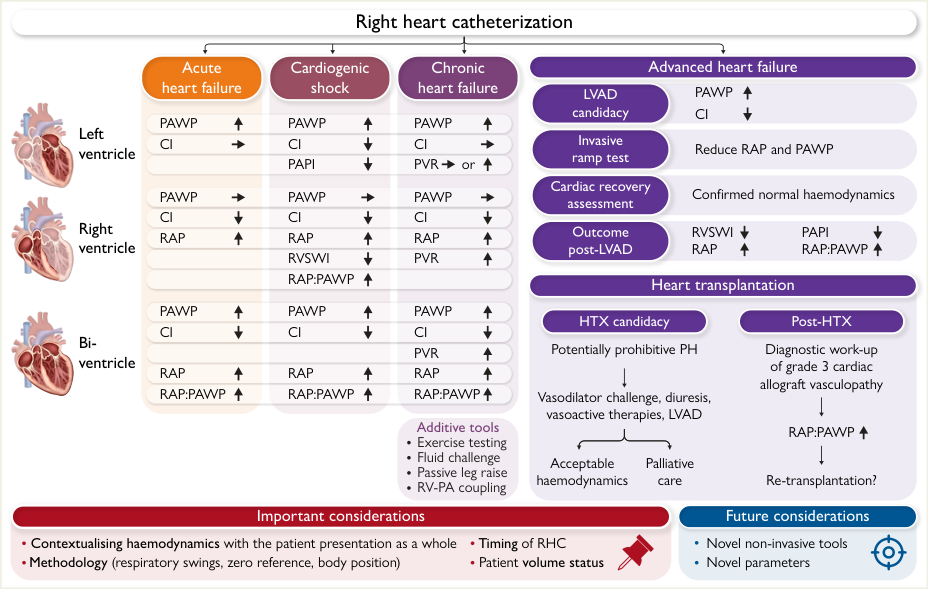
Direction of change in haemodynamic variables by ventricle and scenario (↑ increased, ↓ decreased, → unchanged):
| Ventricle | Acute heart failure | Cardiogenic shock | Chronic heart failure |
|---|---|---|---|
| Left | PAWP ↑, CI → | PAWP ↑, CI ↓, PAPI ↓ | PAWP ↑, CI → |
| Right | PAWP →, CI ↓, RAP ↑, RVSWI ↓ | PAWP →, CI ↓, RAP ↑, RVSWI ↓, RAP:PAWP ↑ | PAWP →, CI ↓, RAP ↑, PVR ↑ |
| Bi-ventricular | PAWP ↑, CI ↓, RAP ↑, RAP:PAWP ↑ | PAWP ↑, CI ↓, RAP ↑, RAP:PAWP ↑ | PAWP ↑, CI ↓, RAP ↑, RAP:PAWP ↑ |
- Advanced heart failure: LVAD candidacy (PAWP ↑, CI ↓) → invasive ramp test (reduce RAP and PAWP) → cardiac recovery assessment (confirmed normal haemodynamics) → outcome post-LVAD (RVSWI ↓, PAPI ↓, RAP ↑, RAP:PAWP ↑)
- Heart transplantation: HTX candidacy — potentially prohibitive PH → vasodilator challenge, diuresis, vasoactive therapies, LVAD → acceptable haemodynamics (→ list) or palliative care. Post-HTX: diagnostic work-up of grade 3 cardiac allograft vasculopathy → RAP:PAWP ↑ → re-transplantation?
- Additive tools: exercise testing, fluid challenge, passive leg raise, RV–PA coupling
- Important considerations: contextualising haemodynamics with the patient's presentation as a whole; methodology (respiratory swings, zero reference, body position); timing of RHC; patient volume status
- Future considerations: novel non-invasive tools; novel parameters
Figure 1 — RHC Waveform Patterns (six panels)
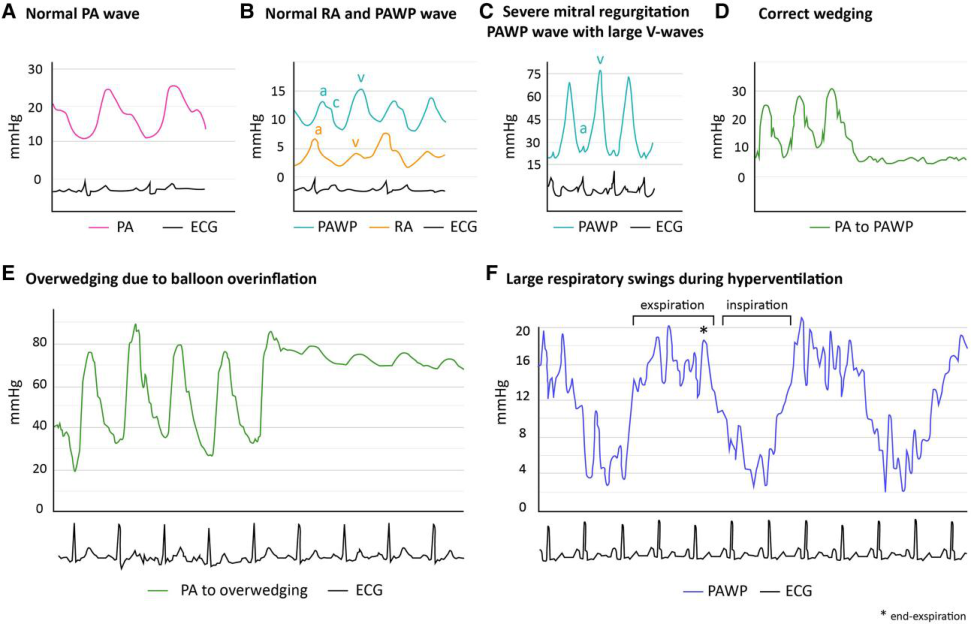
| Panel | Finding | Pressure scale |
|---|---|---|
| A | Normal PA wave | 0–30 mmHg |
| B | Normal RA and PAWP wave — a, c and v waves identified in both | 0–15 mmHg |
| C | Severe mitral regurgitation — PAWP with large V-waves | 0–75 mmHg |
| D | Correct wedging — the PA trace transitions to a PAWP trace | 0–30 mmHg |
| E | Overwedging due to balloon overinflation — PA to overwedging; pressure is too high and the trace loses its typical shape | 0–80 mmHg |
| F | Large respiratory swings during hyperventilation — PAWP varies markedly between expiration and inspiration | 0–20 mmHg, * = end-expiration |
- The panels are the visual basis for the page's waveform rules: correct wedging requires visible A- and V-waves and PAWP ≤ diastolic PAP (panels A, B, D); large V-waves mandate using mean PAWP (panel C); overinflation (panel E) and respiratory swing (panel F) are the two commonest artefacts that produce a falsely high PAWP
Figure 2 — The Central Role of PAWP in Chronic Heart Failure
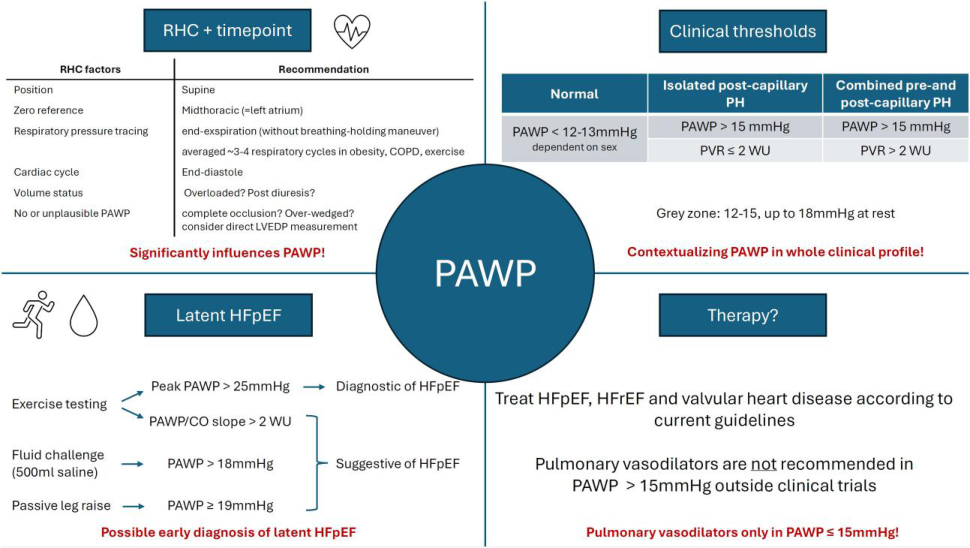
How RHC technique determines the PAWP value — "significantly influences PAWP":
| RHC factor | Recommendation |
|---|---|
| Position | Supine |
| Zero reference | Midthoracic (= left atrium) |
| Respiratory pressure tracing | End-expiration (without breathing-holding manoeuvre); average ~3–4 respiratory cycles in obesity, COPD, exercise |
| Cardiac cycle | End-diastole |
| Volume status | Overloaded? Post-diuresis? |
| No or unplausible PAWP | Complete occlusion? Over-wedged? Consider direct LVEDP measurement |
Clinical thresholds — "contextualising PAWP in the whole clinical profile":
| Category | PAWP | PVR |
|---|---|---|
| Normal | < 12–13 mmHg, dependent on sex | — |
| Isolated post-capillary PH | > 15 mmHg | ≤ 2 WU |
| Combined pre- and post-capillary PH | > 15 mmHg | > 2 WU |
- Grey zone: PAWP 12–15 mmHg, up to 18 mmHg at rest
Latent HFpEF — "possible early diagnosis":
| Provocation | Threshold | Interpretation |
|---|---|---|
| Exercise testing | Peak PAWP > 25 mmHg | Diagnostic of HFpEF |
| Exercise testing | PAWP/CO slope > 2 WU | Suggestive of HFpEF |
| Fluid challenge (500 mL saline) | PAWP > 18 mmHg | Suggestive of HFpEF |
| Passive leg raise | PAWP ≥ 19 mmHg | Suggestive of HFpEF |
Therapy: treat HFpEF, HFrEF and valvular heart disease according to current guidelines. Pulmonary vasodilators are not recommended in PAWP > 15 mmHg outside clinical trials — stated in the figure as "Pulmonary vasodilators only in PAWP ≤ 15 mmHg!"
Figure 3 — Chronic Heart Failure: RHC Variables by Phenotype
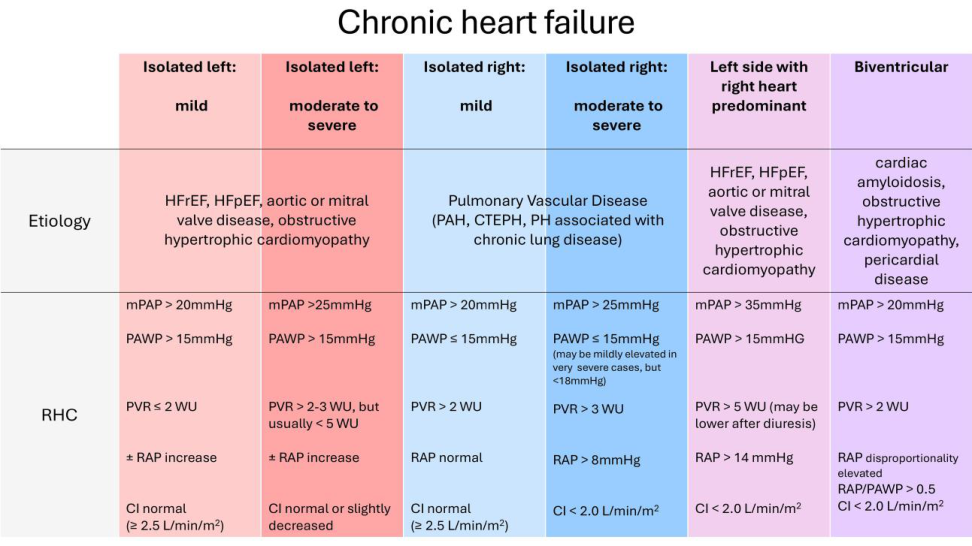
The fullest version of this classification in the paper, and the source of the page's chronic-HF criteria. Six phenotypes across two rows of data:
| Isolated left: mild | Isolated left: moderate–severe | Isolated right: mild | Isolated right: moderate–severe | Left side with right heart predominant | Biventricular | |
|---|---|---|---|---|---|---|
| Etiology | HFrEF, HFpEF, aortic or mitral valve disease, obstructive hypertrophic cardiomyopathy | (as left) | Pulmonary vascular disease (PAH, CTEPH, PH associated with chronic lung disease) | (as right) | HFrEF, HFpEF, aortic or mitral valve disease, obstructive hypertrophic cardiomyopathy | Cardiac amyloidosis, obstructive hypertrophic cardiomyopathy, pericardial disease |
| mPAP | > 20 mmHg | > 25 mmHg | > 20 mmHg | > 25 mmHg | > 35 mmHg | > 20 mmHg |
| PAWP | > 15 mmHg | > 15 mmHg | ≤ 15 mmHg | ≤ 15 mmHg (may be mildly elevated in very severe cases but < 18 mmHg) | > 15 mmHg | > 15 mmHg |
| PVR | ≤ 2 WU | > 2–3 WU, but usually < 5 WU | > 2 WU | > 3 WU | > 5 WU (may be lower after diuresis) | > 2 WU |
| RAP | ± RAP increase | ± RAP increase | normal | > 8 mmHg | > 14 mmHg | disproportionally elevated; RAP/PAWP > 0.5 |
| CI | normal (≥ 2.5 L/min/m²) | normal or slightly decreased | normal (≥ 2.5 L/min/m²) | < 2.0 L/min/m² | < 2.0 L/min/m² | < 2.0 L/min/m² |
Figure 4 — Acute Heart Failure: RHC Variables by Phenotype
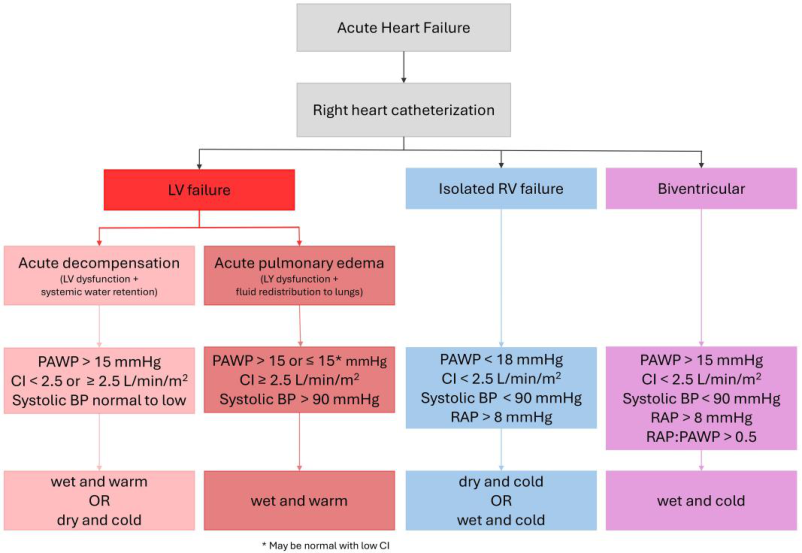
Acute HF → RHC → three branches, with the LV branch splitting into two sub-phenotypes — a distinction the running text does not make:
| Branch | Sub-phenotype | PAWP | CI | Systolic BP | Other | Profile |
|---|---|---|---|---|---|---|
| LV failure | Acute decompensation (LV dysfunction + systemic water retention) | > 15 mmHg | < 2.5 or ≥ 2.5 L/min/m² | normal to low | — | wet and warm OR dry and cold |
| LV failure | Acute pulmonary oedema (LV dysfunction + fluid redistribution to lungs) | > 15 or ≤ 15* mmHg | ≥ 2.5 L/min/m² | > 90 mmHg | — | wet and warm |
| Isolated RV failure | — | < 18 mmHg | < 2.5 L/min/m² | < 90 mmHg | RAP > 8 mmHg | dry and cold OR wet and cold |
| Biventricular | — | > 15 mmHg | < 2.5 L/min/m² | < 90 mmHg | RAP > 8 mmHg; RAP:PAWP > 0.5 | wet and cold |
* May be normal with low CI.
Figure 5 — Shock: RHC Variables by Phenotype, Including SCAI Stages
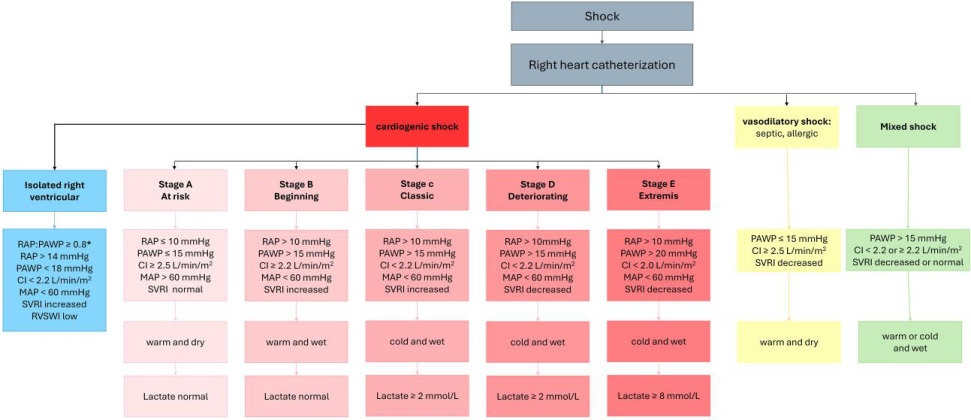
The most granular shock table in the paper, and the source for the page's shock criteria. All values are measured by RHC.
| Phenotype | RAP | PAWP | CI (L/min/m²) | MAP | SVRi | Profile | Lactate |
|---|---|---|---|---|---|---|---|
| Isolated right ventricular | > 14 mmHg (RAP:PAWP ≥ 0.8) | < 18 mmHg | < 2.2 | < 60 mmHg | increased | — | — |
| Cardiogenic Stage A — At risk | ≤ 10 mmHg | ≤ 15 mmHg | ≥ 2.5 | ≥ 60 mmHg | normal | warm and dry | normal |
| Stage B — Beginning | > 10 mmHg | > 15 mmHg | ≥ 2.5 | ≥ 60 mmHg | normal | warm and wet | normal |
| Stage C — Classic | > 10 mmHg | > 15 mmHg | < 2.5 | < 60 mmHg | increased | cold and wet | ≥ 2 mmol/L |
| Stage D — Deteriorating | > 10 mmHg | > 15 mmHg | < 2.2 | < 60 mmHg | decreased | cold and wet | ≥ 2 mmol/L |
| Stage E — Extremis | > 10 mmHg | > 20 mmHg | < 1.8 | < 60 mmHg | decreased | cold and wet | ≥ 8 mmol/L |
| Vasodilatory (septic, allergic) | — | ≤ 15 mmHg | ≥ 2.5 | — | decreased | warm and dry | — |
| Mixed shock | — | > 15 mmHg | < 2.2 or ≥ 2.2 | — | decreased or normal | warm or cold and wet | — |
- Isolated RV shock additionally carries low RVSWI, and the RV column is distinguished by a RAP:PAWP ≥ 0.8 with a normal-to-low PAWP
- The figure supplies the lactate thresholds for SCAI stages C–E (≥ 2, ≥ 2 and ≥ 8 mmol/L respectively) and the vasodilatory/mixed shock comparator columns, neither of which appears in the running text
Figure 6 — Management of PH in Adult HTX Candidates
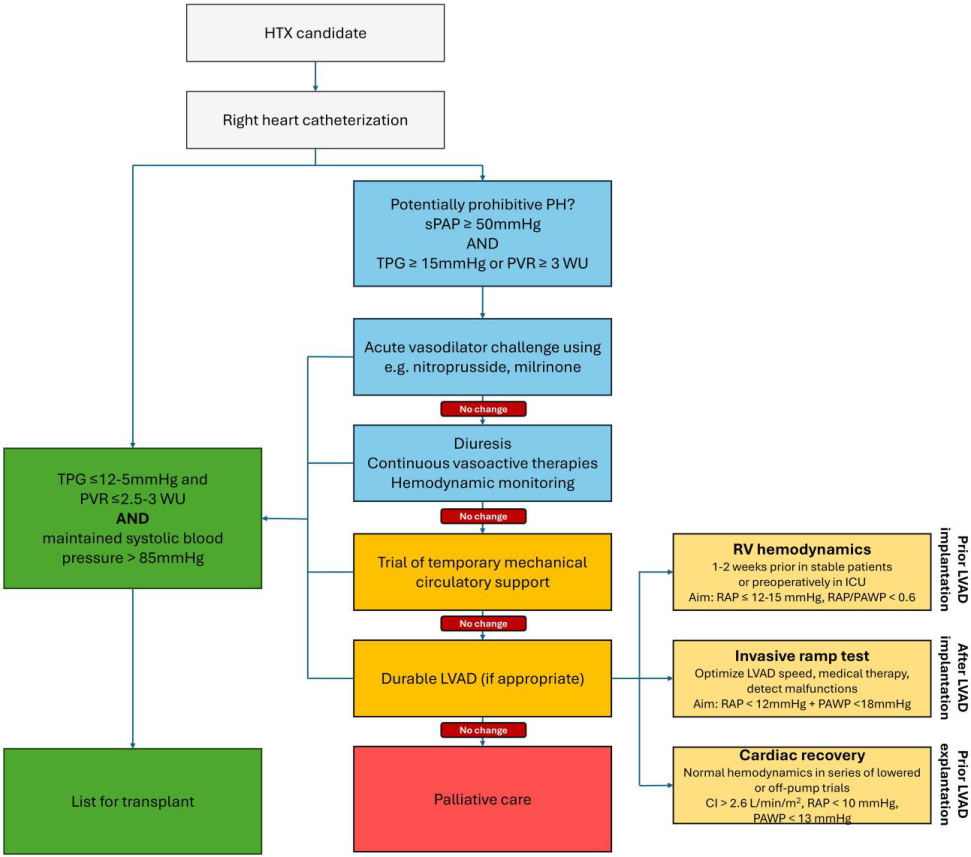
Escalation ladder for a positive vasodilator challenge, with each step's failure triggering the next:
HTX candidate → RHC → potentially prohibitive PH? (sPAP ≥ 50 mmHg AND [TPG ≥ 15 mmHg or PVR ≥ 3 WU])
- Acute vasodilator challenge (e.g. nitroprusside, milrinone) → if no change →
- Diuresis + continuous vasoactive therapies + haemodynamic monitoring → if no change →
- Trial of temporary mechanical circulatory support → if no change →
- Durable LVAD (if appropriate) → if no change →
- Palliative care
Any step that succeeds leads to list for transplant, gated on: TPG ≤ 12–15 mmHg and PVR ≤ 2.5–3 WU AND maintained systolic BP > 85 mmHg
LVAD-phase haemodynamic targets — three distinct phases:
| Phase | Assessment | Target |
|---|---|---|
| Prior LVAD implantation | RV haemodynamics — 1–2 weeks prior in stable patients, or preoperatively in ICU | RAP ≤ 12–15 mmHg; RAP/PAWP < 0.6 |
| After LVAD implantation | Invasive ramp test — optimise LVAD speed and medical therapy; detect malfunctions | RAP < 12 mmHg + PAWP < 18 mmHg |
| Prior LVAD explantation | Cardiac recovery — normal haemodynamics in a series of lowered or off-pump trials | CI > 2.6 L/min/m²; RAP < 10 mmHg; PAWP < 13 mmHg |
Limitations of the document
- State-of-the-art review — no original primary data; synthesises observational evidence and guidelines from different eras
- Most cardiogenic shock data associating RHC with outcome benefit is observational; RCT (NCT05485376) ongoing
- Clinical thresholds across scenarios are derived from heterogeneous studies; no single universal threshold exists for many parameters (e.g. PVR for prohibitive PH)
- Vasodilator testing in HTX candidacy: conflicting data on survival benefit; one US study found no benefit with positive vasodilator test
- PAWP zone of uncertainty (12–18 mmHg) lacks validation for fluid challenge provocative testing
- Figures and graphical abstract survive only as images. The PDF typesets them as graphics with no selectable text, so their content is not searchable in
raw/RHC-HF-EHJ-2025.md. All seven have been read and transcribed into the Data From Embedded Figures section above — but that transcription is manual, and carries a manual-transcription error risk that programmatic extraction would not. Several tables in that section also show values the running text states only partially or not at all (the six-phenotype chronic HF table, the two LV sub-branches of acute HF, the SCAI lactate thresholds, and the vasodilatory/mixed shock comparator columns), so the figures are load-bearing rather than illustrative
Key Concepts Mentioned
- concepts/Right-Heart-Catheterization — central subject of the review
- concepts/Pulmonary-Hypertension — classification framework; pre/post-capillary PH; PVR thresholds
- entities/Heart-Failure — acute, chronic, advanced HF haemodynamic thresholds
- entities/HFpEF — diagnosis via exercise RHC, fluid challenge, passive leg raise; PAWP zone of uncertainty
Key Entities Mentioned
- entities/Heart-Failure — RHC across all HF phenotypes
- concepts/Pulmonary-Hypertension — PH classification; treatment implications
- entities/CTEPH — mentioned in context of pre-capillary PH differential
Wiki Pages Updated
Original ingest (2026-04-19):
wiki/sources/rhc-hf-ehj-2025.md— createdwiki/sourceindex.md— updatedwiki/wikiindex.md— updated (new concept page)wiki/concepts/Right-Heart-Catheterization.md— createdwiki/entities/Heart-Failure.md— updated (RHC section)wiki/concepts/pulmonary-hypertension.md— updated (PAWP methodology and thresholds)
2026-10-16 — source-file repair and figure transcription (no --force re-conversion):
wiki/sources/rhc-hf-ehj-2025.md— new Data From Embedded Figures section; all 7 figures transcribed and embeddedwiki/concepts/SCAI-Shock-Classification.md— RHC-derived haemodynamic values per SCAI stage; the SVRi distinction between stages C and D; vasodilatory, mixed and isolated-RV shock comparator columns; source addedwiki/entities/HFpEF.md— new Latent HFpEF — Invasive Haemodynamic Provocation subsection; source addedwiki/sourceindex.md,wiki/wikiindex.md— rows refreshed
Why no re-conversion was performed. A full pymupdf4llm re-conversion was tested and rejected: the preview produced only 3 images from pages 1–2 against the 8 on disk, with zero name overlap — it would have orphaned and lost five data figures, including the chronic-HF classification table (Figure 3, page 8) and the figures on pages 12, 13 and 15. The existing file was repaired in place instead: the 8 image links were rewritten from C:/drgarywiki/raw/assets/… to /raw/assets/… (now portable and all resolving), and 25 ligature corruptions were corrected (confrm→confirm, fuid→fluid, flling→filling, insuffcient→insufficient, low-fow→low-flow, fuoroscopy→fluoroscopy, fbrillation→fibrillation, signifcantly→significantly, and others). Token count was unchanged at 13,173 through both repairs, confirming no content was lost. Backup: ~/cardiologywiki-backups/RHC-HF-EHJ-2025.md.pre-reconvert-20261016.